Print Formats
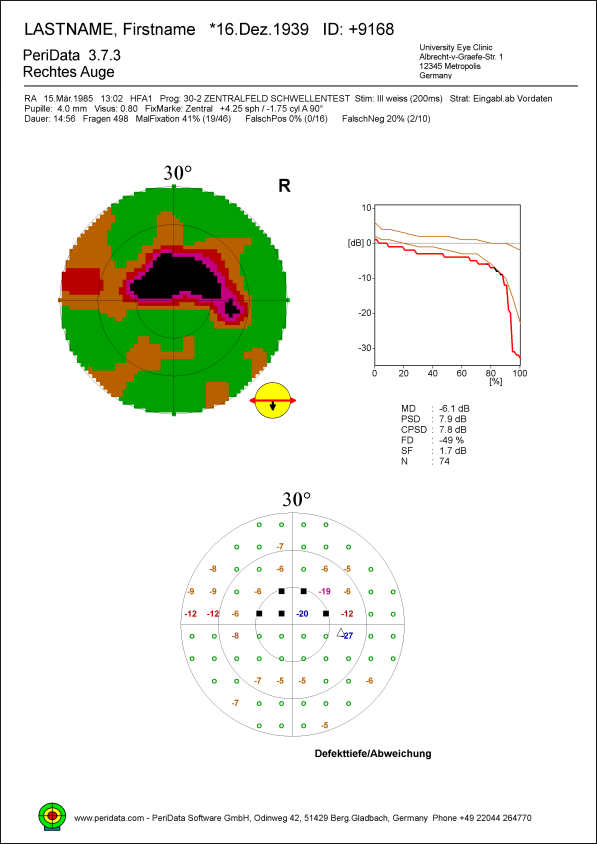
PeriData Single
upper left: Color Defect Map
upper right: cumulative defect curve
lower center: numerical defect values
lower right: standard indices
All representations are based on norm-related values (defect depth or deviation, resp.)
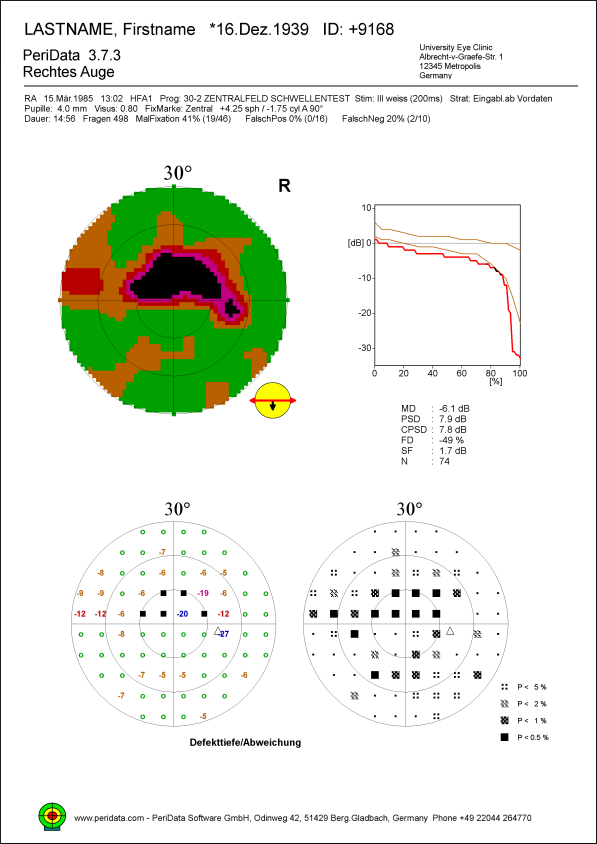
PeriData 4 in 1
upper left: Color Defect Map
upper right: cumulative defect curve
lower left: numerical defect values
lower right: defect probability map
lower right außen: standard indices
All representations are based on norm-related values (defect depth or deviation, resp.)
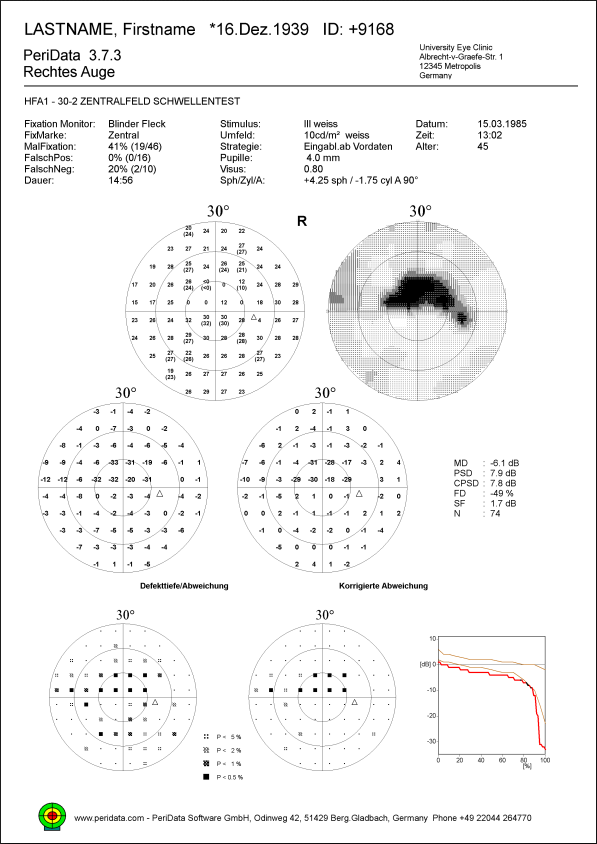
Traditional Single
upper left: threshold values (raw data)
upper right: grayscale der threshold values (raw data)
center left: numerical defect values (deviation from normal)
center right: numerische corrected Defektwerte (corrected deviation)
center outer right: standard indices (norm-related)
lower left: defect probability map
lower right: corrected defect probability map
The representations are based on different values: raw data (threshold values), norm-related values (deviation / defect depth) and shifted norm-related values (corrected deviation)
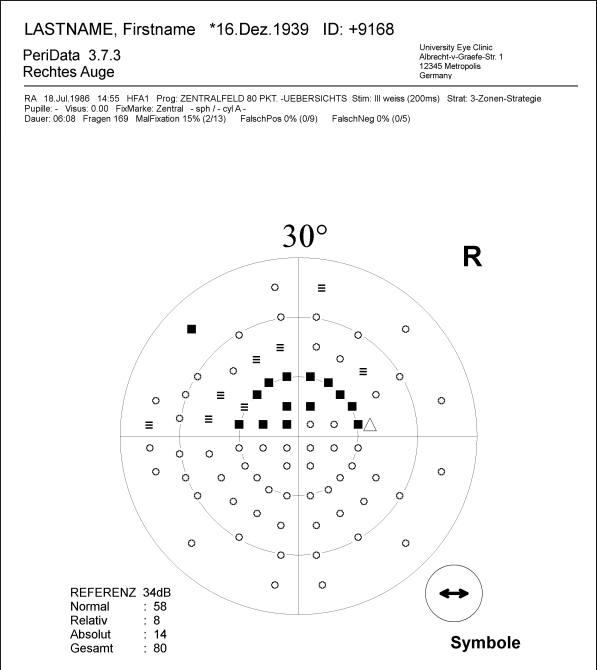
Suprathreshold
center: Defektklassen
lower left: Anzahl in den Defektklassen
lower right: Qualitäts-Indikator
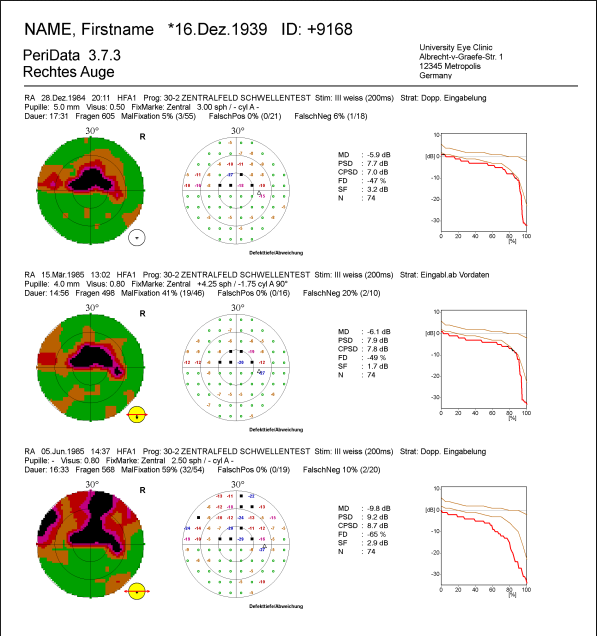
PeriData Series
left: Color Defect Map
center left: numerical defect values
center right: standard indices
right: cumulative defect curve
All representations are based on norm-related values (defect depth or deviation, resp.)
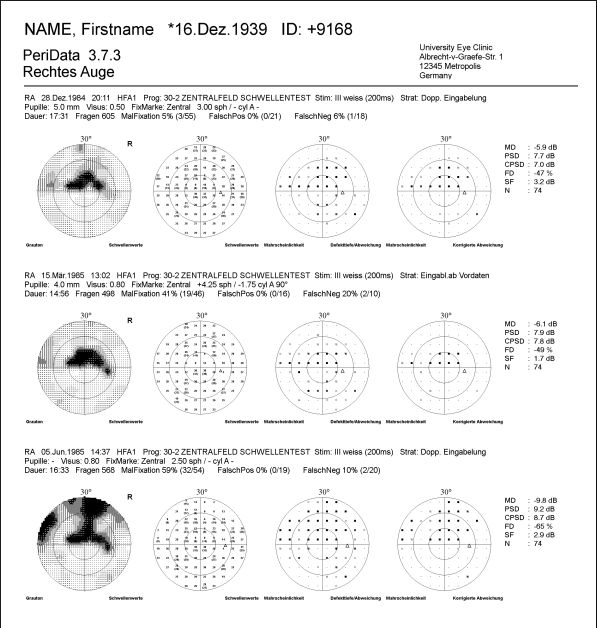
Traditional Series
left: grayscale der threshold values (raw data)
center left: threshold values (raw data)
center: defect probability map
center right: corrected defect probability map
right: standard indices (norm-related)
The representations are based on different values: raw data (threshold values), norm-related values (deviation / defect depth) and shifted norm-related values (corrected deviation)
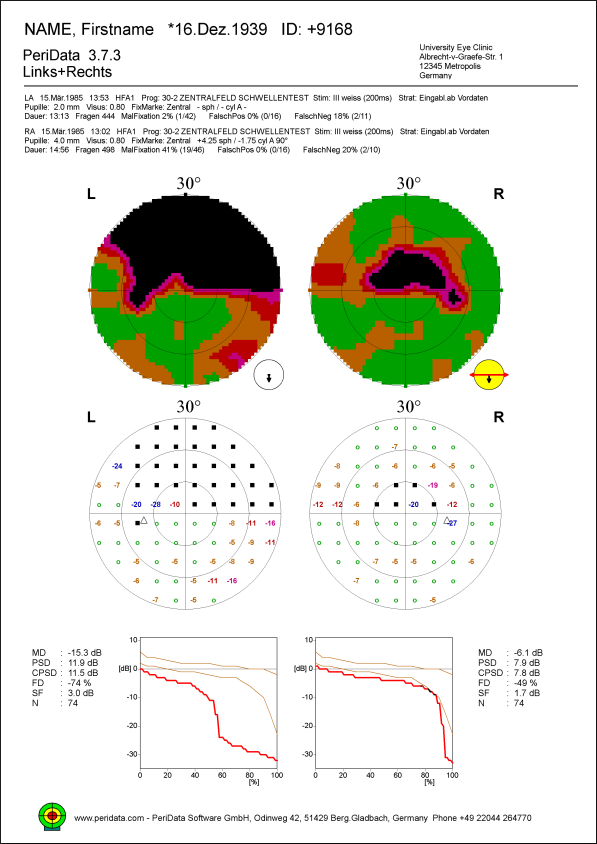
PeriData OD/OS
upper: Color Defect Map
center: numerical defect values
lower center: cumulative defect curve
lower outside: standard indices
All representations are based on norm-related values (defect depth or deviation, resp.)
>
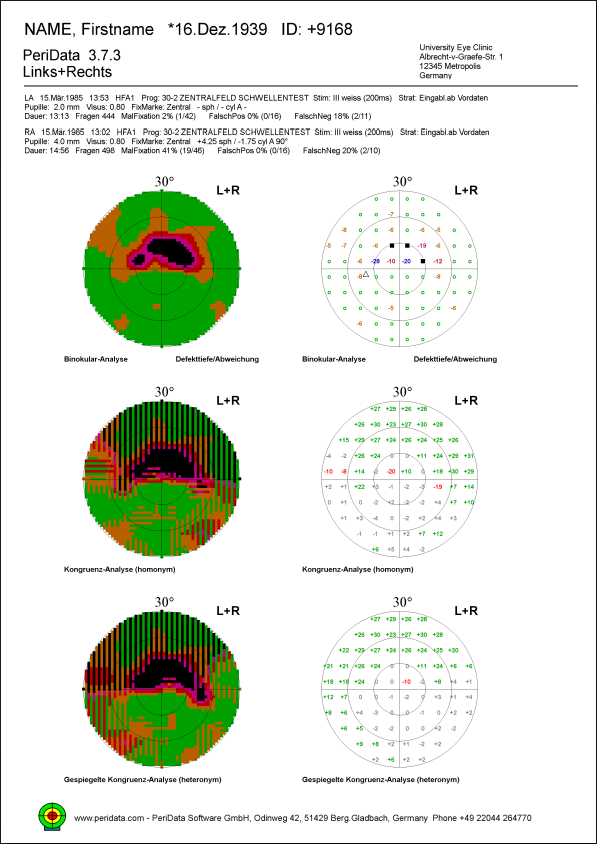
Binocular
upper: Binocular Analysis (best value of both eyes)
center: Congruence Analysis (comparison left-right)
lower: mirror-image Congruence Analysis
All representations are based on norm-related values (defect depth or deviation, resp.)
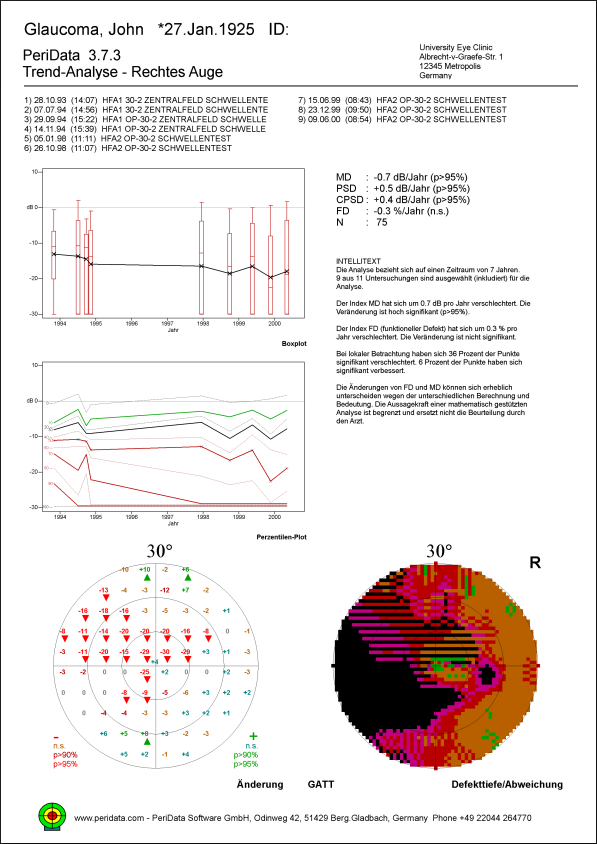
Trend
upper left: Boxplot
upper right: Indices Trend
center left: Percentile Plot
center right: Intellitext
lower left: Change
lower right: GATT
All representations are based on norm-related values (defect depth or deviation, resp.)